bringing
technology
closer to
life


- »
- Business Application Development
- »
- Data Warehouse
ABOUT DATA WAREHOUSE
About
Operational data is a key asset to the organization, but sometimes such data is generally not utilized to its full potential. Thus, the fundamental goal of the data warehouse is to enable user's appropriate access to a homogenized and comprehensive view of the organization, supporting forecasting and decision-making processes at the enterprise level. An additional goal of the data warehouse is to achieve information consistency. By bringing data from different data sources into a centralized repository, the data warehouse provides a homogenized view of the organization's data.
DWH is designed to keep all these things in mind. It is designed in a way that maximum can be utilized from the organization data. It utilizes data by showing it in three layers. The top layer is designed to keep in mind the high level authorities or policy makers(CEO, CFO, President, Vice President etc) that are interested in yearly data for all the locations. Second layer is for middle level authorities(General manager, Plant manager, Regional manager, Divisional manager etc) which are interested in one particular only for period of time. Third layer is for first level authorities(Office manager, Shift supervisor, Department manager etc) that are interested in one division of one location only for period of time.
DWH uses consistent data so whatever be the drill down level, data will be same. Inconsistent data may create a situation of confusion so consistency is necessarily maintained.
Features
The major benefits of maintaining a data warehouse are summarized below :
• Empowers decision-makers by enabling direct access to accurate, consistent, and non-volatile
information and by offering decision-support services that will facilitate the analysis and
interpretation of Institutional data.
• Redirects costly personnel hours from data gathering, matching and consolidating to data analysis.
Reduces the need for information consumers to replicate data and maintain redundant tracking
systems.
• Promotes the no walls culture. The information sharing will lower the walls among all
administrative and academic units, creating alliances and connecting people to each other and the
Institute as a whole.
• Improves data quality over time. Broader access to information will help better to define what types
of information we need on hand for effective decision-making. This will identify areas for
improvement in data gathering functions and data entry.
• Enhances organizational effectiveness by extending and expanding the use of management
information across the organization. The extensive use of management information will eventually
promote the analytical culture that places value on information and analysis.
• Improves integrity and conformity of organization-wide information. As more people in organization
use the data, error will be identified and corrected thereby improving data integrity over time.
• Improves access to the historical data. Historical data will be available to the broader campus
community for ad hoc access and analytical processing.
• Provides direct support to Institute executives and the organizations in collection, analysis,
interpretation, and provision of Institute information.
Full Screenshot Tour
-
Home Page
data warehouse is to enable user's appropriate access to a homogenized and.. -
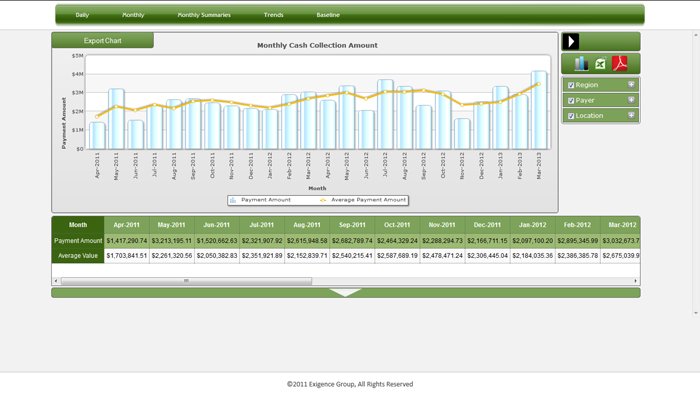
Cash Collection
Monthly cash collection provides information of cash collected monthly ... -
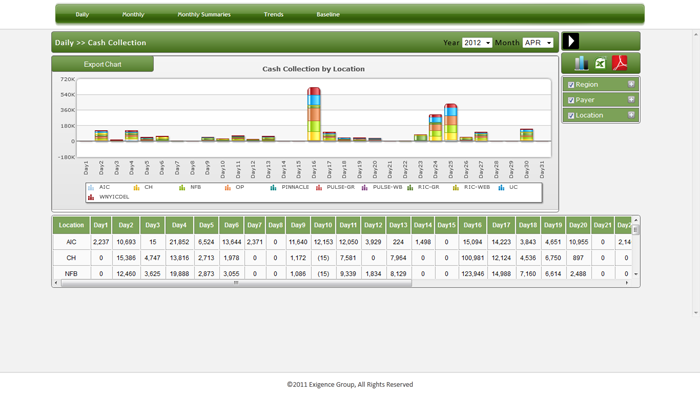
Cash Collection
Cash collection daily shows collected cash for a month of particular year on.. -
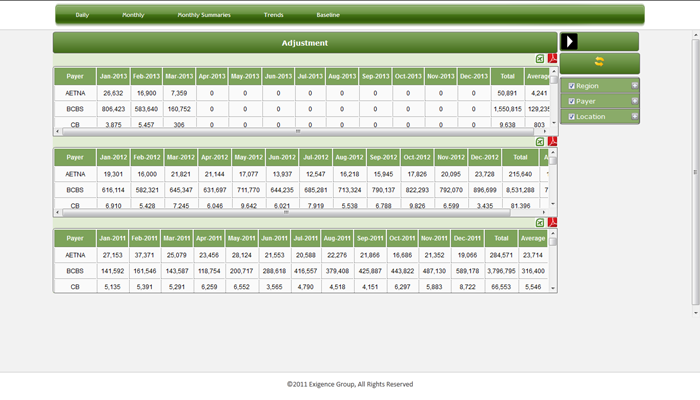
Monthly Summary Report
Monthly summaries provides monthly report of last three year for adjustment, billed volume,... -
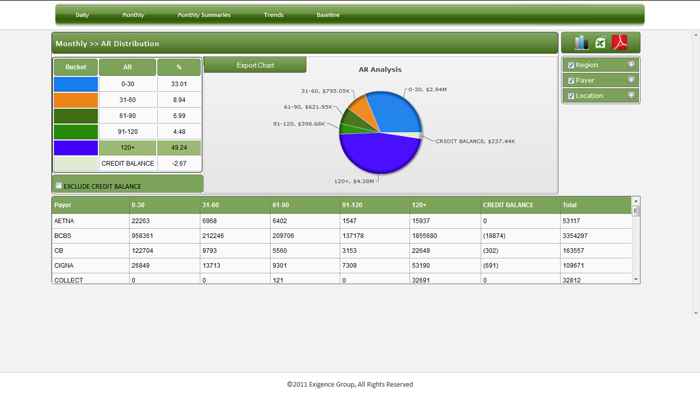
AR Distribution
AR distribution show how company data is managed according to days bucket... -
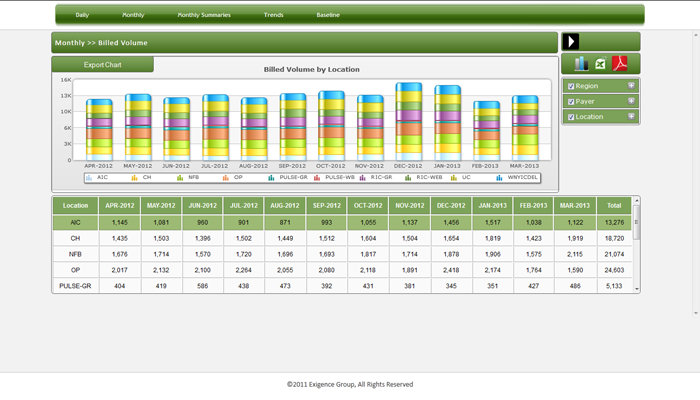
Billed Volume
Billed volume shows last 12 months report of total number of generated voucher... -
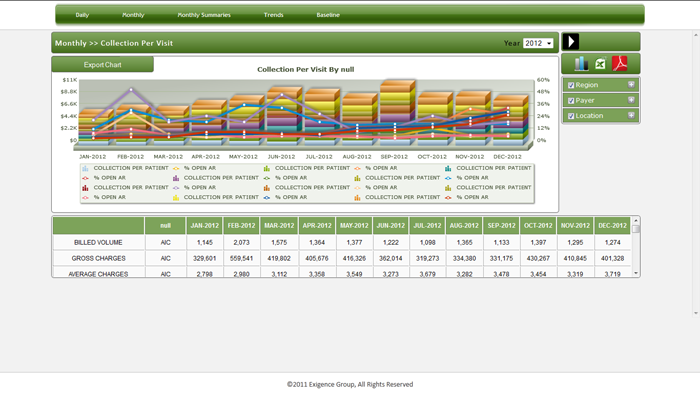
Collection Per Visit
Monthly collection per visit shows data of collection for per visit by.. -
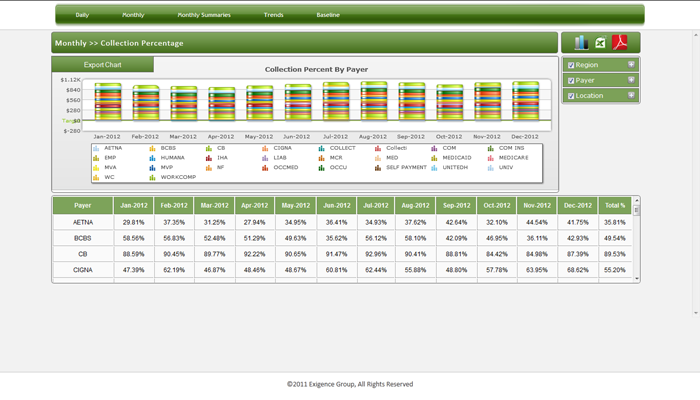
Collection Percentage
Collection percentage show cash collected in percentage form .... -
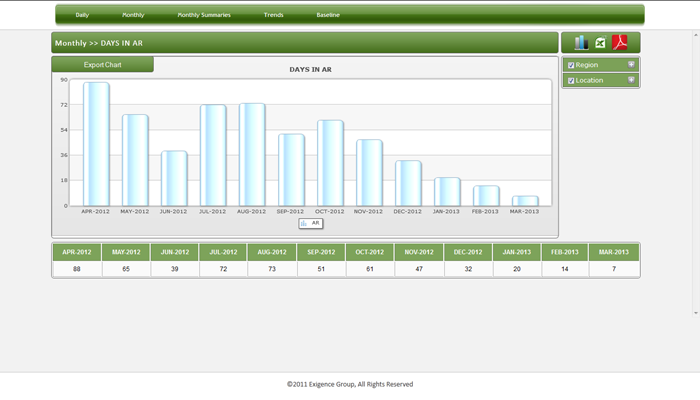
Days In AR
Days in AR shows average number of days for last 12 months for account receivables... -
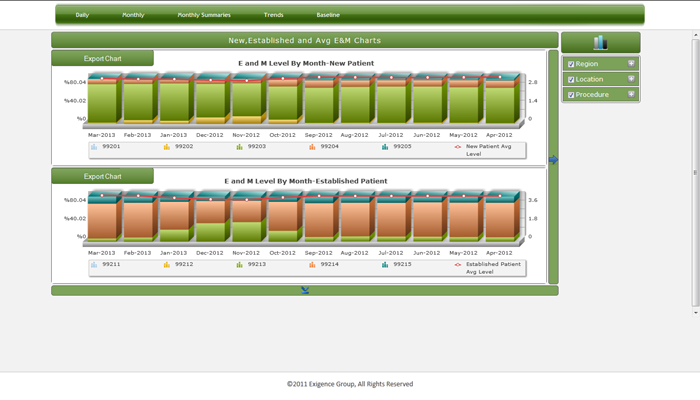
E&M
E&M shows monthly e&m level on basis of new and existing patient... -
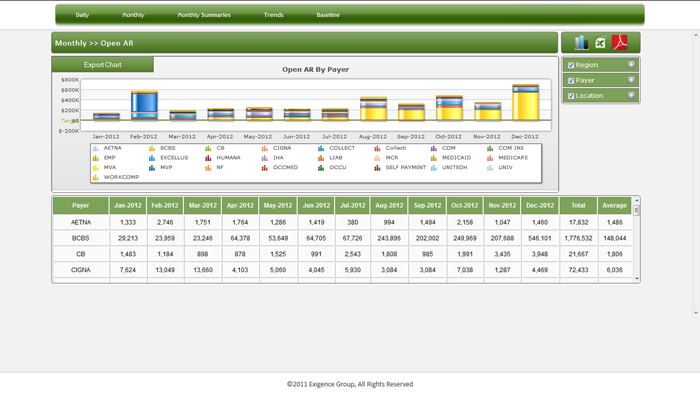
Open AR
Open AR shows cash for last 12 months for account receivables to be pending from... -
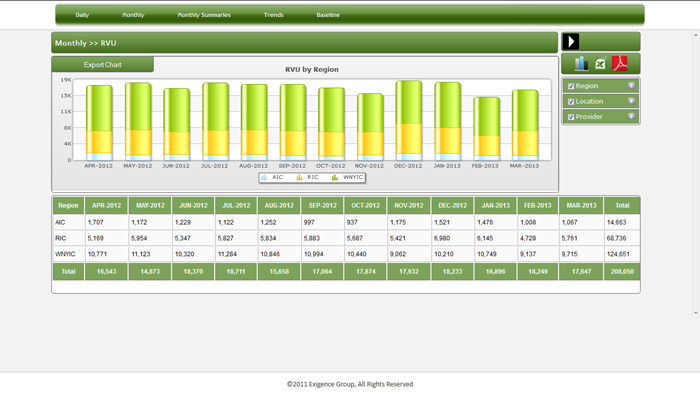
RVU
Relative value unit used to find ranking of doctors to give increment... -
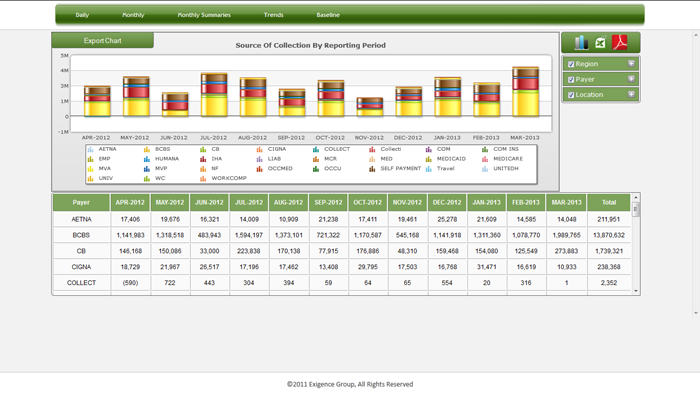
Source of Collection
Source of collection shows collected cash by payor for a .... -
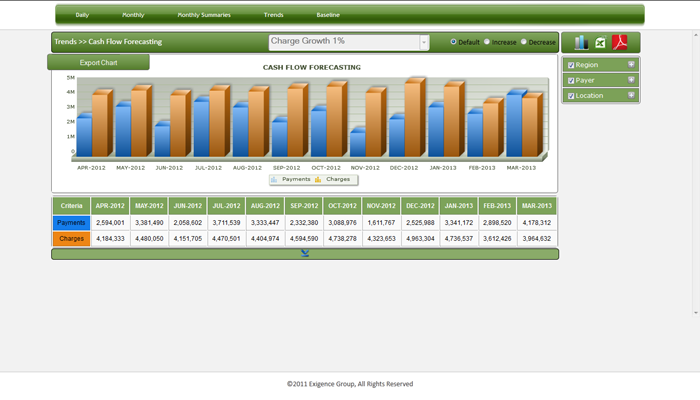
Cash Flow Forecasting
Cash flow forecasting provides functionality to forecast how much growth .. -
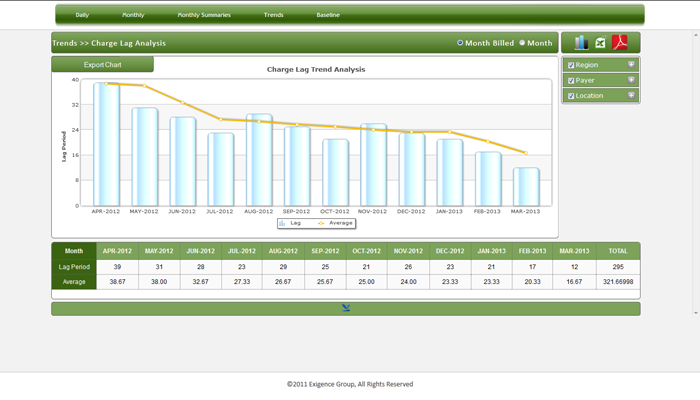
Charge Lag analysis
Charge lag analysis show average number of days of last 12 months for charge lag .. -
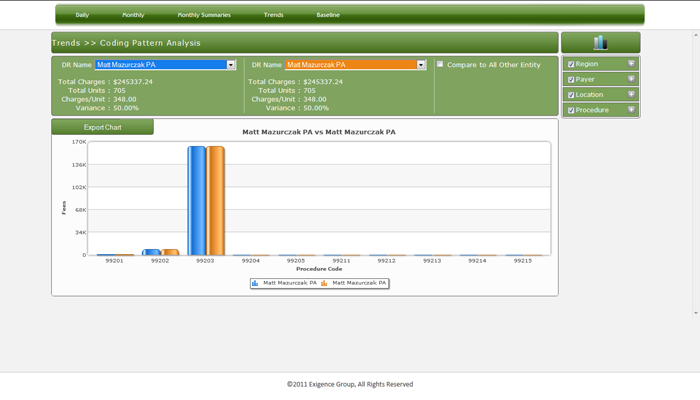
Coding Pattern Analysis
Coding pattern analysis show analysis/comparison of charges on basis of procedure code... -
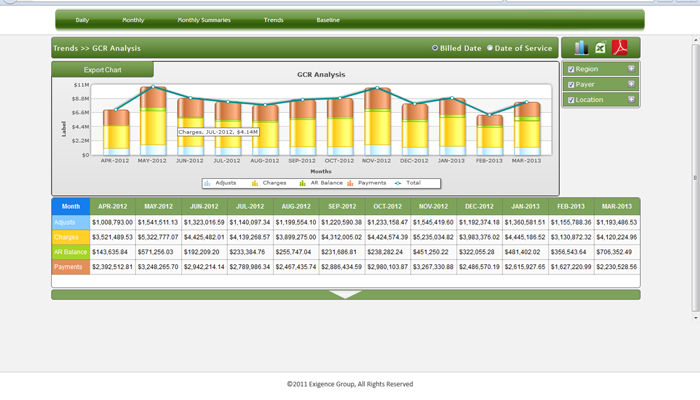
GCR Analysis
GCR analysis shows gross charges rate analysis for adjustment, charges, payment... -
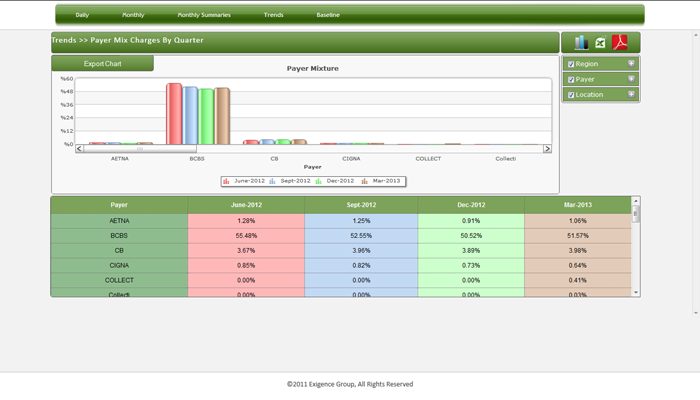
Payer Mix Charges
Payer mix charges shows quarterly charges data for last 12 months ... -
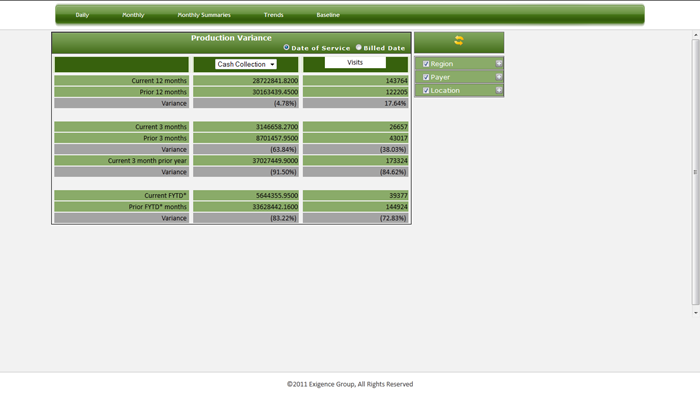
Production Variance
Production variance shows variation for cash collection, billed volume, Charges by ...
| ISO 9001:2008 Certified | | | © Copyright 2024 Yusata. All rights reserved | | | Terms of Use | | | Privacy Policy | | |